Author: Bruno SEUX

  • Data Governance for Heterogeneous SQL Databases (2026)

    Data Governance for Heterogeneous SQL Databases (2026)

    Data Governance for Heterogeneous SQL Databases (2026)

    How to Manage Data Governance Across Heterogeneous SQL Databases

    Managing data governance across multiple SQL databases – PostgreSQL, MySQL, SQL Server, and others – requires a unified metadata model paired with database-specific enforcement. This article explains how to build a federated governance architecture that keeps policies consistent while respecting each database’s native capabilities. Discover the four pillars of effective governance and how to prioritize governance capabilities for enterprise compliance and data quality.

    With 137 active data privacy laws globally as of February 2026, organizations running mixed database environments face compounding compliance pressure. Without a coherent cross-database strategy, governance becomes reactive and fragmented – research from Bluent puts the average annual cost of poor data governance at $12.9 million for enterprise organizations.

    Table of contents

    Why Is Governance So Complex Across Heterogeneous SQL Databases?

    A heterogeneous database environment combines multiple distinct systems – each with its own dialect, access control model, and storage engine. A team might run PostgreSQL for transactional data, MySQL for application databases, and SQL Server for financial reporting. Each platform implements row-level security, column encryption, and audit logging differently.

    Governance becomes complex because there is no shared enforcement layer. A policy defined in SQL Server’s RBAC system does not translate automatically to PostgreSQL’s row-level security or MySQL’s privilege model. Teams end up maintaining parallel policy definitions, reconciling naming conventions across schemas, and tracking data lineage without a unified view.

    What is a heterogeneous database?

    A heterogeneous database environment is one where two or more distinct database management systems coexist – typically from different vendors, using different query languages or storage models. This is common in organizations that grew through acquisition or adopted specialized databases for specific workloads.

    Why governance becomes complex with multiple SQL platforms

    Each SQL platform has independent access control implementations, schema metadata formats, and audit capabilities. Unified policies must be translated into platform-specific configurations, and any drift between platforms creates compliance gaps that standard auditing tools rarely surface automatically.

    The Four Pillars of Data Governance

    Effective data governance rests on four operational pillars regardless of how many database systems are involved.

    Metadata and business glossary establishes shared definitions for every column, table, and relationship. Without this, two teams querying “revenue” from different databases may measure entirely different things.

    Data ownership and stewardship assigns named accountability. Each dataset has an owner responsible for its accuracy, classification, and documentation. In heterogeneous environments, stewardship is split by database but coordinated through a central catalog.

    Classification and access controls map sensitivity levels to enforcement rules. PII fields require masking or column-level restrictions; financial data may require row-level security filters. Classification must be consistent across all databases even when enforcement mechanisms differ.

    Lineage and quality monitoring tracks how data flows between systems and flags anomalies. A broken upstream table in PostgreSQL can silently corrupt a downstream report in SQL Server – lineage visibility is the early-warning layer.

    How Do You Build a Unified Metadata Model Across Multiple Databases?

    A unified metadata model is a canonical representation of your data assets that exists independently of any single database. It maps physical schemas from PostgreSQL, MySQL, SQL Server, or Oracle to a shared logical layer where governance policies are defined once, then translated per platform.

    The key architectural decision is separating logical governance from physical implementation. Business glossary entries, ownership records, classification tags, and lineage graphs live in the logical layer. Platform-specific enforcement – RBAC rules, column masks, audit configurations – is generated from it as a downstream artifact.

    Creating a canonical metadata layer

    Schema import is the entry point. Tables, columns, data types, foreign keys, and constraints are pulled from each database and normalized into a shared format. Teams then annotate with business context: descriptions, ownership assignments, and sensitivity classifications. Tools with multi-database SQL support ingest MySQL, PostgreSQL, and SQL Server schemas into a single workspace, removing the need for separate documentation per platform.

    Separating logical governance from physical implementation

    Once the canonical layer exists, policies become database-agnostic. A “PII – restricted” classification applied to an email column in the logical model can generate a column mask in SQL Server, a row security policy in PostgreSQL, and a privilege restriction in MySQL – written once, rendered per platform.

    API-Driven Architecture: Centralized Policies, Decentralized Enforcement

    API-Driven Architecture: Centralized Policies, Decentralized Enforcement

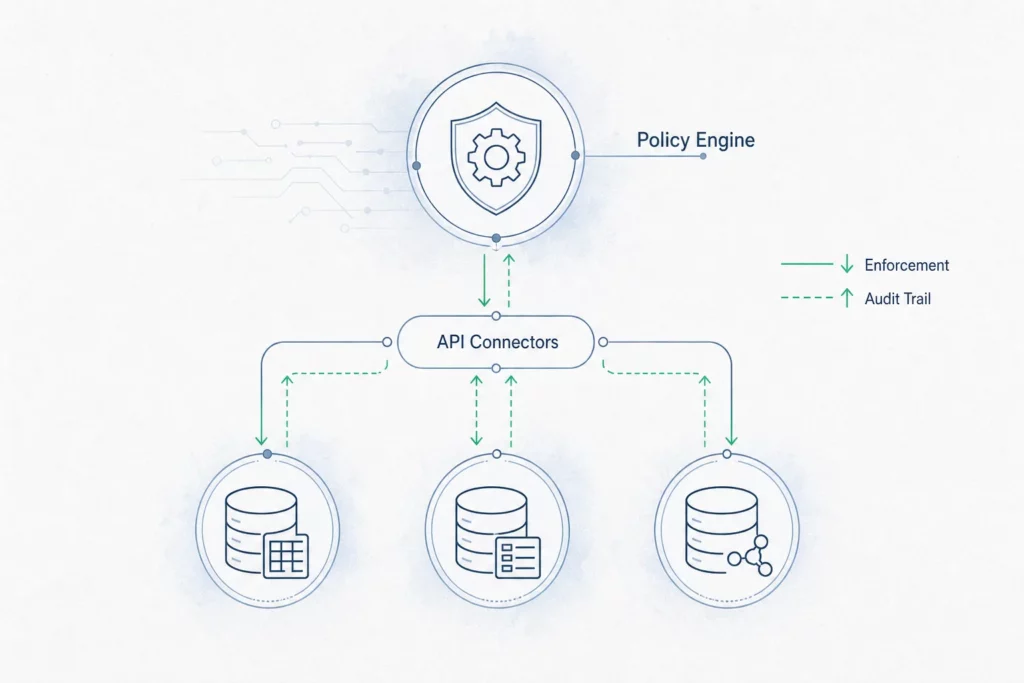
    An API-driven governance architecture places a policy engine at the center of your data infrastructure. Each database system exposes its access control and audit capabilities via APIs or connectors, and the policy engine distributes decisions without rewriting them per platform.

    Research published on MDPI demonstrates this architecture works natively across PostgreSQL, SQL Server, MongoDB, and DynamoDB, eliminating vendor lock-in while maintaining consistent enforcement. A new compliance requirement – masking national ID numbers – is configured once and propagates to all connected databases automatically.

    The architecture has three layers: a metadata catalog storing schema definitions, business context, and policy rules; a policy engine translating rules into platform-specific configurations; and database connectors applying those configurations without per-system SQL rewrites. Interactive schema visualization across all connected databases gives teams a live view of changes and their downstream impact.

    Creating Your Data Governance Catalog

    A data governance catalog is the operational hub for your metadata model – combining schema documentation, business glossary, ownership records, lineage graphs, and audit logs in a single, searchable interface accessible to developers, analysts, and data stewards.

    Metadata ingestion starts with schema import: tables, columns, types, and relationships are pulled from each database and normalized. Teams then annotate with business context. Data ownership and classification are maintained as first-class attributes – each table or column has an assigned owner and a sensitivity label. Cross-database lineage tracking shows how a field in one system maps to downstream queries in another, making impact analysis reliable. Audit logging captures every change to the catalog: who modified a classification, when ownership changed, and why.

    Implementing Data Governance: A Practical Roadmap

    Governance programs that begin with technology selection before defining business outcomes tend to stall. The approach that works starts with the opposite: identify one high-value compliance or operational pain point, govern it end-to-end, and expand from there.

    A team managing GDPR compliance across three databases should first map every column holding personal data, assign an owner to each table, apply classification tags, and configure column-level restrictions. Once that baseline is operational and auditable, the same process extends to the next database or the next regulatory requirement.

    The $6.3 billion data governance software market in 2026, according to SR Analytics, reflects genuine organizational demand – but investment without a clear outcome produces catalogs that nobody maintains. Pick a measurable goal (audit readiness, reduced incidents, faster onboarding) and build governance around it. For practical documentation approaches that underpin each governance layer, the database documentation guide covers schema metadata capture at import time.

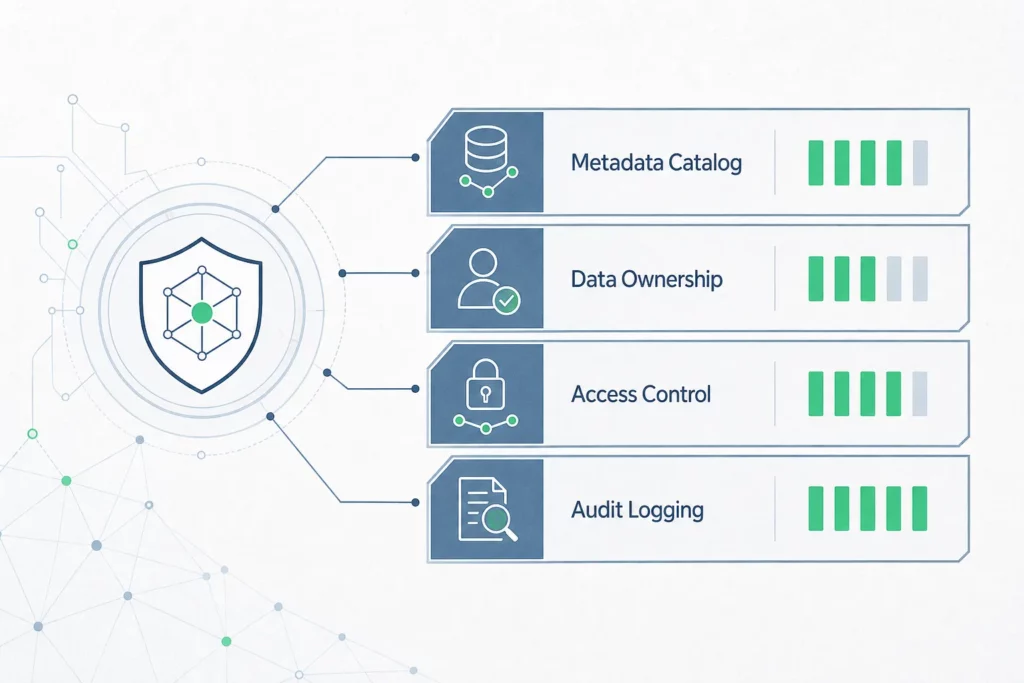
    The capability priority order that consistently works: metadata catalog and business glossary first, then ownership and classification, then access controls and column/row-level security, then lineage and quality monitoring, then audit and compliance reporting as the automated byproduct of the layers below.

    What Governance Capabilities Matter Most for Heterogeneous SQL Environments?

    Infographic : What Governance Capabilities Matter Most for Heterogeneous SQL Environments?

    When selecting a solution for mixed SQL environments, evaluate these capabilities in order of operational impact:

    CapabilityWhy it matters
    Metadata catalog and business glossaryShared definitions across all databases
    Data ownership and stewardshipNamed accountability per dataset
    Identity and access managementRole-based controls synchronized across platforms
    Data classification and maskingSensitivity labels applied consistently
    Column and row-level securityEnforced at the database layer, not the application
    Data lineage and impact analysisCross-database visibility of dependencies
    Data quality monitoringAnomaly detection on schema and value changes
    Audit and compliance reportingGenerated automatically from the governance layer

    The key selection criterion for heterogeneous SQL environments is native connector coverage. A tool that supports MySQL, PostgreSQL, and SQL Server without requiring custom integrations per platform eliminates a preventable class of ongoing maintenance overhead. Automatic schema documentation on import removes the manual annotation burden that derails most governance programs in their first year.

    Why Automatic Database Documentation Is the Foundation of Governance

    The most common reason governance programs fail is that metadata capture is manual, delayed, and inconsistent. A classification applied three months after schema deployment is remediation, not governance.

    Automatic schema documentation changes this sequence. When a schema is imported, tables, columns, foreign keys, and constraints are captured immediately and made available for annotation, classification, and ownership assignment – before the database enters production. Policies attach to schema objects at the point of definition rather than being retrofitted later.

    In a heterogeneous environment, this means every connected database – MySQL, PostgreSQL, SQL Server – feeds the same documentation layer. A new table in any system appears in the governance catalog automatically, triggering ownership and classification workflows. The catalog becomes a live source of truth rather than a document that drifts from reality within weeks of deployment.

    Research from Promethium shows that organizations implementing structured metadata governance achieve 25-40% improvements in data management metrics within the first year. Teams managing multiple databases manually reconcile schema exports after each deployment, audit classification consistency across systems, and update documentation after schema changes. Automatic import eliminates these reconciliation cycles – and combined with collaborative annotation accessible to developers, analysts, and product managers, governance becomes a distributed team practice that scales across heterogeneous SQL environments.

    FAQ

    What is a heterogeneous database?

    A heterogeneous database environment consists of two or more distinct database management systems within the same organization – for example, PostgreSQL for transactional workloads, MySQL for application data, and SQL Server for financial reporting. Each has its own query language, access control model, and metadata format.

    What is the difference between homogeneous and heterogeneous databases?

    A homogeneous environment uses a single database platform across all workloads, simplifying governance because policies, controls, and monitoring use the same mechanisms. A heterogeneous environment mixes platforms, requiring governance tools that can abstract policy definitions from platform-specific enforcement.

    What are the four pillars of data governance?

    The four pillars are metadata management and business glossary, data ownership and stewardship, data classification and access controls, and data lineage and quality monitoring. Together they provide the definitional, organizational, protective, and observability layers that governance requires.

    How do you centralize governance across multiple databases?

    Build a canonical metadata layer – a central catalog where schema definitions, business context, ownership records, and policy rules are maintained – then push platform-specific enforcement configurations to each database from that central layer. This separates policy definition from policy execution.

    What is a federated governance architecture?

    A federated governance architecture maintains a central policy authority while enforcement is distributed across each database using its native controls. Policies are defined once and translated into platform-specific configurations, eliminating the need to maintain separate governance programs per database.

    Why is metadata management critical for heterogeneous database governance?

    Metadata is the connective tissue between databases. Without a shared metadata layer, classification, ownership, and lineage records exist in isolation per system, making cross-database governance impossible to coordinate or audit. A unified metadata model is the prerequisite for every other governance capability.

  • What is a data dictionary? Team asset in 2026

    What is a data dictionary? Team asset in 2026

    Data dictionary puzzle

    Data puzzle ?

    What is a data dictionary: your team’s source of truth for data

    A data dictionary is a centralized repository documenting what data means, its structure, and the business rules governing it – enabling every team member to interpret fields consistently and reduce costly misinterpretation. Far more than a tool reserved for database administrators, a modern data dictionary serves as a collaborative asset accessible to developers, analysts, product managers, and support teams alike. It establishes a living source of truth that evolves with your data governance needs, so that a field labeled revenue means the same thing in finance, engineering, and operations – without anyone having to ask.

    Content

    What is a data dictionary?

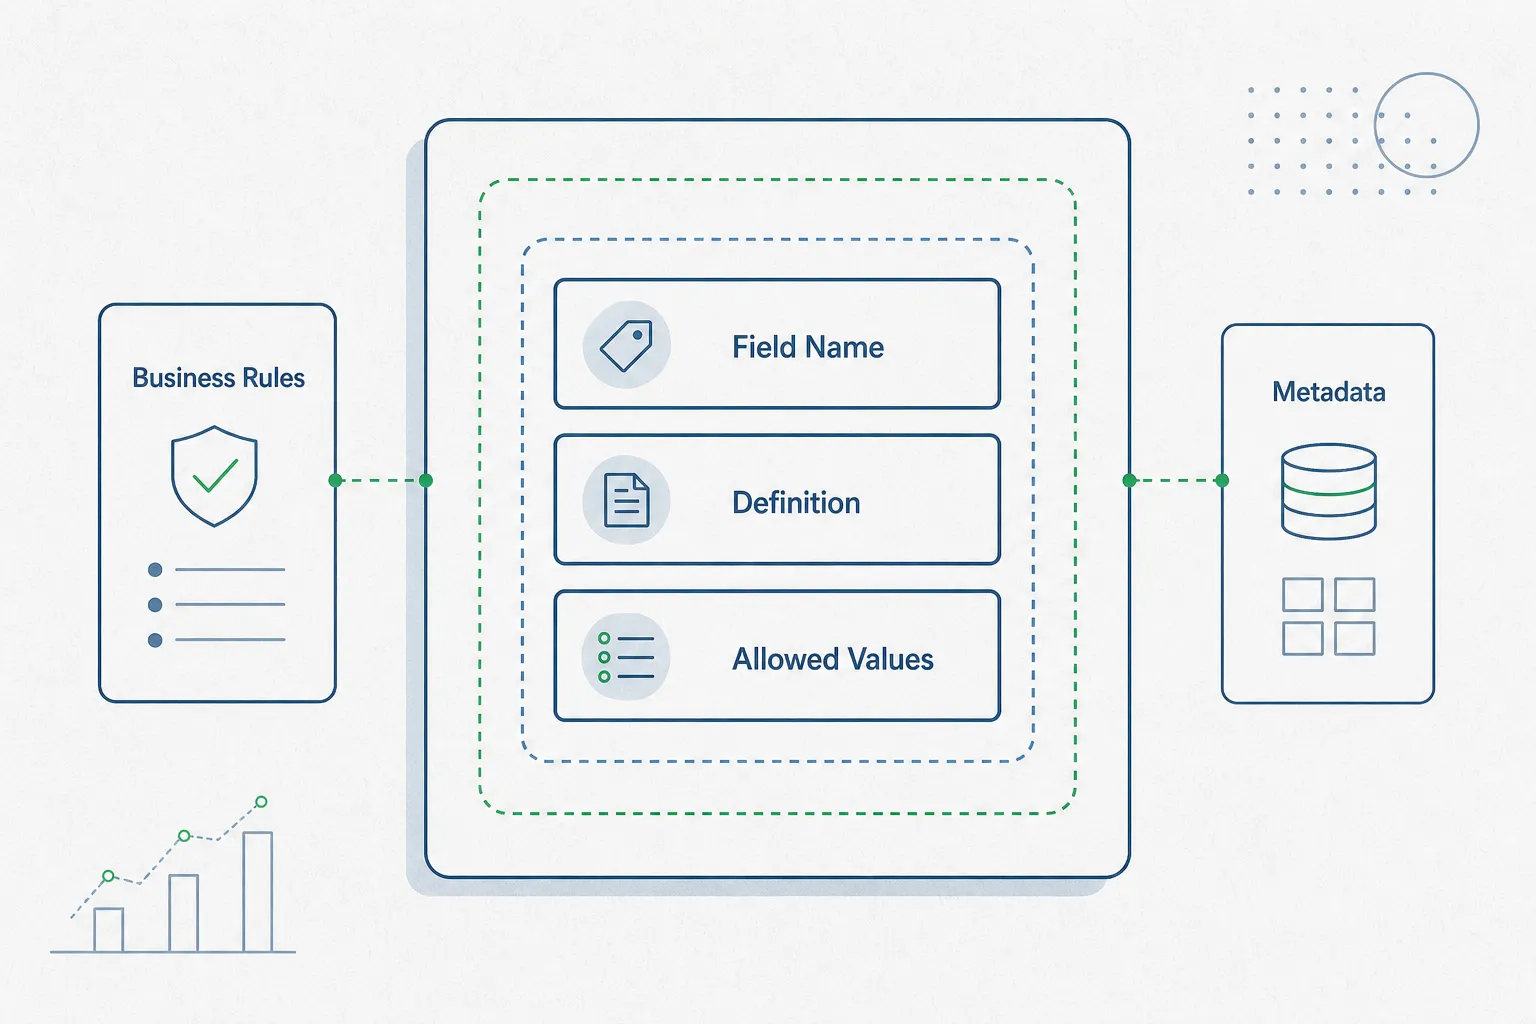
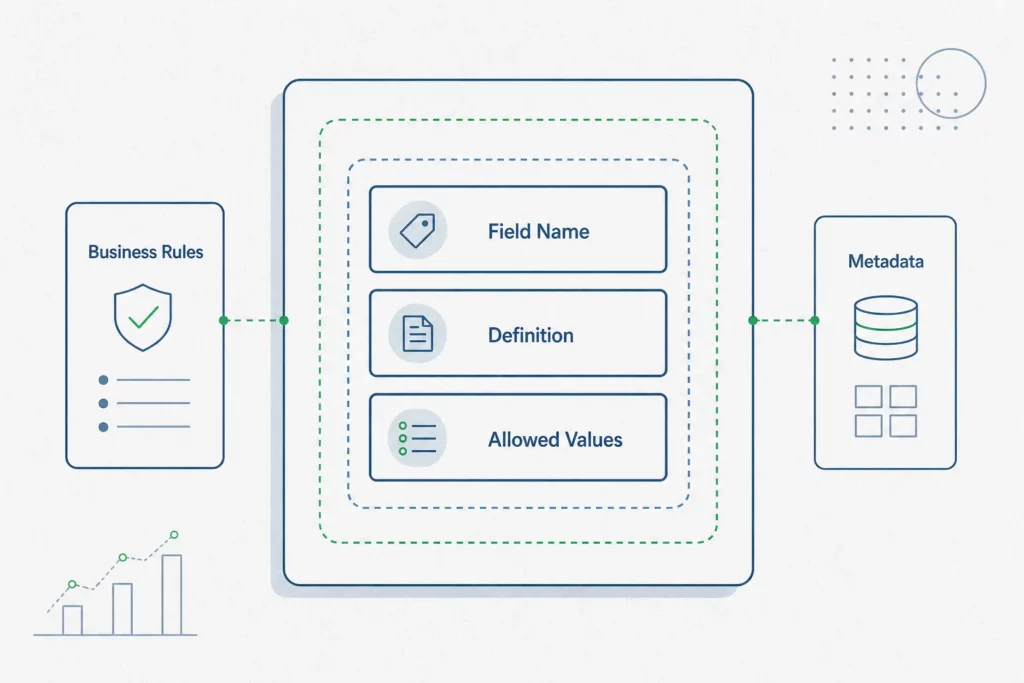
    A data dictionary is a structured document or system that defines every data element within a dataset or database: its name, data type, allowed values, business meaning, and relationships to other fields. Think of it as the authoritative reference your team consults before writing a query, building a report, or onboarding a new analyst.

    Simple definition

    At its core, a data dictionary answers three questions for each field: what is it called, what does it contain, and what rules apply to it. According to USGS data management guidelines, a complete data dictionary includes field names, data types, definitions, allowed values, units, null handling rules, business rules, relationships, and lineage information – eight to ten components that together make a field unambiguous.

    Example: a customer records data dictionary

    Consider a customers table with a field named status. Without a dictionary, one developer interprets it as an account lifecycle stage, another as a payment flag. With a dictionary entry, the field reads: status (VARCHAR, allowed values: active, churned, suspended; updated by billing system on payment event; owned by the Revenue Operations team). Everyone works from the same definition.

    How it differs from a database

    A database stores the data itself – rows, columns, indexes, relationships. A data dictionary stores knowledge about that data: its meaning, context, and governance rules. The database answers “what values exist”; the dictionary answers “what those values mean and who is responsible for them.”

    Why does your team need a data dictionary?

    Teams that operate without a shared data dictionary consistently run into the same friction: analysts re-derive definitions that already exist, engineers hardcode assumptions that break downstream, and compliance audits reveal inconsistencies that take weeks to untangle.

    Preventing data misinterpretation

    The National Center for Education Statistics highlights a recurring example: confusion between monthly revenue and annual revenue in shared reports produces compounding errors that require significant rework to correct. Shared definitions remove that ambiguity at the source. When mrr is documented as “monthly recurring revenue in USD, excluding one-time fees, calculated on the first of each month,” no one misreads it as an annualized figure.

    Enabling cross-functional collaboration

    Data dictionaries support five critical organizational functions according to NCES guidance: data analysis, database development, data integration, documentation, and regulatory compliance. That span matters because it confirms the dictionary’s role crosses team boundaries. A PM reviewing a dashboard, a support agent checking a customer field, and a developer writing a migration script all need the same baseline understanding – and the dictionary provides it without requiring a meeting.

    Supporting compliance and governance

    Regulatory frameworks require organizations to demonstrate control over their data: what is collected, how it is used, and who can access it. A data dictionary with ownership fields, lineage information, and audit trails turns compliance from a reactive scramble into a documented, auditable record. ISO/IEC 11179, the international standard for metadata registries, provides the formal framework that enterprises use to standardize and distribute data definitions at scale.

    What components should a data dictionary include?

    data dictionary components

    A data dictionary only delivers value when its entries are complete enough to be unambiguous. Partial documentation – field name only, or definition without allowed values – still leaves room for misinterpretation. When you need to document across multiple databases running different engines such as MySQL, PostgreSQL, or SQL Server, consistent component coverage becomes even more important.

    Field names and data types

    Every entry starts with the technical field name (exactly as it appears in the schema) and its data type: VARCHAR, INTEGER, BOOLEAN, TIMESTAMP, and so on. This alone prevents type mismatch errors when teams query the same field from different tools.

    Definitions and allowed values

    The definition is the plain-language explanation of what the field represents in business terms. Allowed values list the acceptable inputs – particularly important for categorical or status fields. Where a field follows an enumeration, list every valid value and what it means operationally.

    Relationships and validation rules

    Document foreign key relationships, dependencies between fields, and any validation logic applied at the application or database level. A field that is only populated when another field holds a specific value needs that rule recorded explicitly, not left implicit in code comments.

    Ownership and lineage information

    Each field should have a named owner or owning team, a source system (where the data originates), and transformation notes if the value is derived. Lineage information makes debugging faster and compliance reporting straightforward – two outcomes that justify the documentation overhead on their own.

    How do effective data dictionaries improve teamwork?

    The most underexplored value of a data dictionary is not technical accuracy – it is the reduction of organizational friction. When definitions live in a shared, searchable system rather than in the memory of one senior analyst, teams scale their data knowledge without linear growth in communication overhead.

    Role-based access for different users

    A well-designed dictionary serves different audiences without requiring different documents. A developer needs the technical schema detail: data types, constraints, index notes. An analyst needs the business definition and allowed values. A product manager needs ownership and update frequency. A support agent needs plain-language descriptions. When the dictionary surfaces the right depth for each role, it becomes a tool people actually consult rather than a document people archive.

    Living documentation that evolves

    Static data dictionaries decay. Schema changes, business rule updates, and team ownership shifts happen continuously, and a dictionary that does not reflect them becomes worse than no dictionary – it actively misleads. Effective dictionaries require periodic review cycles and structured approval workflows to maintain accuracy as data landscapes evolve, as outlined in OvalEdge’s best practices research. Version history and change timestamps let teams trace when a definition changed and why.

    Centralized source of truth

    When definitions are scattered across Confluence pages, README files, Slack threads, and individual spreadsheets, the implicit rule becomes: “whoever shouts loudest wins.” A centralized dictionary imposes a single canonical answer. Teams stop debating definitions in meetings because the record exists and is accessible to everyone with a browser.

    How should you build and maintain a data dictionary?

    building a data dictionary

    Building a data dictionary from scratch can feel overwhelming when a schema contains hundreds of tables and thousands of fields. The answer is not to document everything at once – it is to start where the stakes are highest and establish sustainable habits. For a practical approach to how to effectively document databases, the sequence matters as much as the content.

    Prioritize high-impact data first

    Best practice from enterprise implementations is clear: document revenue, compliance, and customer analytics data before anything else. These fields appear in the most reports, carry the most regulatory weight, and cause the most damage when misunderstood. A complete dictionary for your ten highest-stakes tables delivers more value than partial entries across every table in the schema.

    Establish clear ownership and review cycles

    Every field needs an owner who is accountable for keeping its definition current. Without named ownership, entries go stale the moment the person who wrote them changes roles. Pair ownership with a review cadence – quarterly for stable domains, monthly for fast-moving ones – and require documented sign-off when definitions change.

    Automate where possible to reduce overhead

    Manual documentation is the single biggest reason data dictionaries fail to scale. When teams must hand-write every field name, data type, and relationship from scratch, the effort quickly exceeds the perceived benefit. The alternative is to automate schema documentation by importing the schema directly from the database, letting the tool populate technical fields automatically so your team focuses on adding business context – definitions, owners, and rules – rather than transcribing structure that already exists.

    Frequently asked questions

    What is the difference between a data dictionary and a business glossary?

    A data dictionary documents technical data elements at the field level: names, types, validation rules, and database-level context. A business glossary defines higher-level business concepts – “Customer,” “Revenue,” “Churn” – in plain language for non-technical audiences. The two are complementary: the glossary defines what a concept means to the organization; the dictionary maps that concept to the specific fields and tables that implement it.

    What should I include in a data dictionary?

    A complete entry covers the field name, data type, plain-language definition, allowed values, null handling rules, relationships to other fields, validation logic, source system, owning team, and last-reviewed date. Not every entry requires every component from day one – prioritize the fields with the highest business impact and expand coverage iteratively.

    Why do teams struggle to maintain data dictionaries?

    The two recurring failure modes are lack of ownership and manual overhead. When no one is explicitly responsible for keeping an entry current, it drifts. When updating the dictionary requires more effort than just asking a colleague, teams revert to informal channels. Automated schema import and structured review workflows address both problems directly.

    How often should a data dictionary be updated?

    Update entries whenever the underlying schema or business rule changes – ideally as part of the same workflow that approves the change. In addition, schedule a periodic review: quarterly for stable domains is a reasonable baseline, with more frequent cycles for fields tied to active product development or regulatory reporting.

    Can data dictionaries be automatically generated?

    Yes. Tools that connect directly to a database schema can import field names, data types, and relationships automatically, eliminating the most labor-intensive part of the process. The human contribution then shifts to adding definitions, business context, and ownership – the knowledge that cannot be derived from the schema alone. This approach reduces the time-to-first-draft from weeks to hours.

    What is the ISO standard for data dictionaries?

    ISO/IEC 11179 is the international standard for metadata registries. It defines how data elements should be described, named, and registered so that definitions can be standardized and shared across an enterprise or between organizations. Compliance with ISO/IEC 11179 is particularly relevant for organizations operating in regulated industries or participating in cross-institutional data exchanges.

  • Database Relationship Diagrams Explained (2026)

    Database Relationship Diagrams Explained (2026)

    Database Relationship Diagrams Explained (2026)

    Database Relationship Diagrams: Building the Blueprint for Better Data Documentation in 2026

    Database relationship diagrams (ERDs) are visual blueprints that map entities, attributes, and relationships within a database system. Using industry-standard notations like Crow’s Foot, ERDs help teams communicate complex data structures, reduce redundancy, and catch design issues early. Whether you’re designing an e-commerce platform, healthcare system, or financial application, ERDs provide a shared understanding of how data flows and connects – making them valuable for database developers, architects, analysts, and non-technical stakeholders alike. The challenge most teams face in 2026 is not creating ERDs, but keeping them synchronized with fast-moving production schemas.

    What Is a Database Relationship Diagram?

    A database relationship diagram – commonly called an Entity-Relationship Diagram or ERD – is a structured visual representation of the tables, fields, and connections that make up a relational database. As IBM defines it, ERDs function as both a blueprint for initial database design and a reference point for debugging and reengineering after deployment (verified 2026-08-29). That dual-purpose nature is precisely what gives them staying power across the full data lifecycle.

    Definition and core components

    An ERD is built from three fundamental components. Entities represent the objects or concepts being tracked – typically the tables in a relational database, such as Customer, Order, or Product. Attributes are the properties of each entity – the columns in a table, like customer_id, email, or created_at. Relationships describe how entities connect: a customer places orders, a product belongs to a category.

    These three components – entities, attributes, and relationships – are the vocabulary of every ERD regardless of notation style or tooling. They translate directly into tables, columns, and foreign keys when the schema is implemented.

    How ERDs differ from other data visualization methods

    ERDs are frequently confused with data flow diagrams (DFDs), but the two serve different purposes. A DFD models how data moves through a system – inputs, processes, outputs, and storage. An ERD models the structure of data at rest: what exists, what it looks like, and how pieces relate. Where a DFD answers “how does data travel?”, an ERD answers “how is data organized?”. Both are legitimate documentation tools; they just address different questions.

    Why ERDs have become a database design standard

    ERDs emerged from Peter Chen’s foundational 1976 paper and have since been adopted across industries because they translate inherently abstract schema logic into something human-readable. A developer can read a schema by scanning table definitions; a product manager cannot. An ERD bridges that gap without requiring SQL literacy, which is why they remain a design standard across enterprise and startup environments alike.

    Why Do Database Relationship Diagrams Matter to Your Organization?

    Relational databases grow in complexity faster than documentation keeps pace. As Atlassian notes, ERDs help eliminate data redundancy while ensuring data integrity in relational databases (verified 2026-08-29) – two problems that compound silently until they surface as production bugs or incorrect reporting.

    Improving communication across technical and non-technical teams

    Schema logic written purely in SQL is accessible only to engineers with database experience. An ERD makes the same information readable by analysts, product managers, and support teams. When a new team member joins, a well-maintained ERD cuts onboarding time significantly because the data structure becomes self-explanatory. When a business stakeholder needs to understand why a report behaves a certain way, pointing to an ERD is faster and more precise than narrating table structures verbally.

    Reducing data redundancy and ensuring data integrity

    Without a visual overview of the schema, engineers working on different parts of the same system will often create overlapping tables or duplicate attributes that serve the same purpose. An ERD makes these collisions visible before they reach production. It also surfaces missing foreign key constraints and relationships that would otherwise allow orphaned records – records that reference deleted parent rows – to accumulate over time and silently corrupt analytical outputs.

    Catching schema design issues before deployment

    A schema flaw is cheapest to fix when it exists only on paper. Normalizing a table structure after data has been loaded, after application code has been written around it, or after reporting queries have been built on top of it is an expensive operation. ERDs make structural decisions explicit at the point where they’re easiest to revise – during design.

    Understanding ERD Symbols and Cardinality Notation

    Infographie : Understanding ERD Symbols and Cardinality Notation

    Reading an ERD fluently requires knowing its notation conventions. The symbols are not arbitrary; they encode precise logical rules about how records in one table relate to records in another.

    Crow’s Foot notation: the industry-standard symbols

    Crow’s Foot notation is the most widely used ER diagram notation standard in relational database design (source: freeCodeCamp, verified 2026-08-29). The name comes from the three-pronged symbol that indicates “many” on the end of a relationship line – it resembles a bird’s foot. On the opposite end, a single vertical bar means “exactly one” and a circle means “zero”. Combinations of these symbols define the precise cardinality of each relationship.

    Reading cardinality: one-to-one, one-to-many, and many-to-many

    Cardinality specifies how many instances of one entity can be associated with instances of another. According to Creately, cardinality in ERDs is represented using six combinations: zero-or-one, exactly-one, zero-or-many, and one-or-many on each side of a relationship (verified 2026-08-29).

    In practice:

    • A one-to-one relationship (user to user_profile) means each record on the left maps to exactly one record on the right.
    • A one-to-many relationship (customer to orders) means one customer can have many orders, but each order belongs to one customer.
    • A many-to-many relationship (products to tags) requires a junction table to resolve the association at the database level.

    Misreading cardinality is one of the most common ERD errors. A line drawn the wrong way implies a foreign key constraint that doesn’t exist, or fails to imply one that does – leading to schema implementations that don’t match the intended data model.

    Entity attributes and primary keys in ERD representation

    In most ERD notations, entity boxes list the attributes of the table. The primary key – the attribute that uniquely identifies each row – is typically underlined or marked with a key icon. Foreign keys, which create the joins between tables, are often shown in italic or marked explicitly to distinguish them from regular attributes. A clean ERD shows enough attribute detail to understand the data model without replicating the full column definitions of every table.

    Real-World Use Cases: Where ERDs Drive Success

    ER diagrams are used across four primary domains: business information systems, healthcare, education, and financial services (source: Built In, verified 2026-08-29). Each domain has structural patterns that ERDs capture naturally.

    E-commerce and CRM systems: customer and order management

    In an e-commerce context, the core ERD typically centers on the relationship between Customer, Order, OrderLine, and Product. A customer places many orders; each order contains multiple order lines; each order line references one product. Capturing this in an ERD before writing a single query ensures that foreign keys, cascading deletes, and inventory update logic are built around the correct data structure from the start.

    Healthcare: patient records and billing workflows

    Healthcare databases are among the most structurally complex in any industry. A Patient entity connects to Appointments, Diagnoses, Prescriptions, and Billing records – often with regulatory requirements about how those connections must be preserved or anonymized. An ERD makes these dependencies visible to compliance teams who need to verify data governance without reading raw SQL definitions.

    Educational platforms: enrollment and grade management

    An educational platform tracks students, courses, enrollments, instructors, and grades. Many-to-many relationships appear throughout: a student enrolls in many courses; a course has many students. ERDs help platform architects resolve these into proper junction tables (Enrollment) early, preventing the data model from accruing technical debt through ad hoc schema decisions.

    Financial systems: transaction and account tracking

    Financial databases demand strict referential integrity. A Transaction must always reference a valid Account; an Account belongs to a Customer. ERDs make these constraints explicit and provide auditors with a visual reference they can cross-check against implemented constraints – without requiring direct database access.

    How to Create an Effective Database Relationship Diagram

    Illustration : How to Create an Effective Database Relationship Diagram

    Building a useful ERD follows a repeatable process. The goal at each step is to make an explicit decision rather than leaving structure implicit.

    Step 1: Identify entities and attributes

    Start by listing the objects your system needs to track. For each object, identify its attributes – the data points you need to store per instance. At this stage, focus on completeness rather than precision. It is easier to remove attributes than to discover missing ones after the schema has been built out.

    Step 2: Define relationships and cardinalities

    For every pair of entities, ask: can an instance of A exist without an instance of B? Can one A relate to many Bs? Express these rules as cardinality constraints on your diagram. Decisions made here translate directly into foreign keys, NOT NULL constraints, and cascade behaviors in the implementation.

    Step 3: Normalize your design to prevent anomalies

    Normalization is the process of organizing tables to reduce redundancy and protect data integrity. First Normal Form (1NF) eliminates repeating groups; Second Normal Form (2NF) removes partial dependencies; Third Normal Form (3NF) eliminates transitive dependencies. An ERD that reflects a normalized schema prevents the update, insert, and delete anomalies that corrupt databases over time.

    Step 4: Document and validate with stakeholders

    Once the diagram is drawn, walk through it with the people who will use the system – not just developers. A product manager can often identify missing entities that the technical team took for granted. A data analyst can spot attributes that will make future reporting impossible. Validation at this stage is the difference between a schema that serves the business and one that serves only the use cases the engineers happened to think of. For a detailed breakdown of this workflow, the database documentation best practices on SQLInfo cover how to structure this process end-to-end.

    From Static Diagrams to Live Schema Visualization

    The most underserved problem in database documentation is not how to draw an ERD – it is how to keep one accurate after the schema has been deployed and is changing week over week.

    Bridging the gap between design and implementation

    Every schema starts with a design artifact. But the moment a migration runs, that artifact begins to drift from reality. Columns are added, tables are renamed, foreign key constraints are dropped for performance reasons. The ERD that was accurate on release day describes a schema that no longer exists six months later. For teams that rely on that ERD for onboarding, debugging, or compliance reviews, the discrepancy is a liability.

    Why static ERDs become outdated quickly

    In fast-moving development environments, schema changes often happen without any corresponding update to documentation. This is not negligence – it is a structural problem. When an engineer adds a column, the natural workflow is to write the migration, run it, and move on. Updating a separately maintained diagram requires context-switching to a different tool, finding the relevant entity, and manually editing the representation. Under deadline pressure, this step is skipped. The result is documentation that is selectively trustworthy – and documentation that cannot be trusted selectively is often not used at all.

    Keeping ERD documentation synchronized with actual database schemas

    The solution is to flip the workflow: instead of maintaining ERDs manually and hoping they stay current, generate them automatically from the live schema. When documentation is derived directly from the database – not maintained separately alongside it – it cannot drift. Every schema change surfaces immediately in the visual representation.

    SQLInfo’s schema visualization features take this approach: the diagram is not a static file but a live view of the actual relationships present in the schema at any given moment. Combined with automatic schema import from live databases, the ERD becomes a source of truth rather than a record of intent. Because the agent CLI runs locally, raw schema data never leaves the client’s infrastructure – which matters in regulated industries where even metadata about database structure is subject to governance requirements.

    This shift from “ERD as design artifact” to “ERD as living documentation” changes how teams use diagrams. Rather than consulting an ERD only at the start of a project, engineers and analysts reference it continuously as a navigational tool for the production database.

    Frequently Asked Questions About Database Relationship Diagrams

    What is the difference between an entity relationship diagram and a data flow diagram?

    An entity relationship diagram models the static structure of data: which entities exist, what attributes they carry, and how they relate to one another. A data flow diagram models the dynamic movement of data through a system – inputs, processes, outputs, and data stores. ERDs answer the question “how is data organized?”; DFDs answer “how does data move?”. Both are useful, but they document different aspects of a system and should not be treated as interchangeable.

    How do you read cardinality symbols in a Crow’s Foot ERD?

    Each end of a relationship line in Crow’s Foot notation carries two symbols: one indicating the minimum (zero or one) and one indicating the maximum (one or many). A circle represents zero; a single vertical bar represents one; a crow’s foot (three-pronged mark) represents many. To read the cardinality of a relationship, look at both ends of the line: the symbols closest to each entity tell you the minimum and maximum number of instances of that entity that can participate in the relationship.

    What are the key steps to creating an ERD from an existing database?

    Start by extracting the current schema – table definitions, column names, data types, primary keys, and foreign keys. Most database management systems expose this through information schema views or dedicated introspection queries. Map each table to an entity and each column to an attribute. Then trace the foreign key relationships between tables to establish the connections. The resulting diagram reflects the schema as implemented, which may differ from any original design documentation that exists. Tools that support automatic schema import can perform this extraction automatically, eliminating the manual transcription step.

    Why do ERDs become outdated and how can teams keep them current?

    ERDs become outdated because maintaining them manually requires a deliberate action that sits outside the normal development workflow. Every migration that does not trigger a corresponding diagram update creates drift. The practical solution is automation: when an ERD is generated directly from the live schema rather than maintained by hand, it updates whenever the schema does. Teams that treat their ERD as a derived artifact rather than a manually curated document eliminate the root cause of drift rather than relying on discipline to prevent it.

    Can ERDs be created automatically from database schemas?

    Yes. Most modern database documentation platforms can introspect a live schema and generate a relationship diagram from it automatically. The process typically involves connecting to the database, reading the information schema, and mapping foreign key constraints to relationship lines. The resulting diagram accurately reflects the actual schema – not a design that may have diverged from implementation over time. For PostgreSQL, MySQL, and SQL Server environments, this introspection is straightforward and does not require any schema modifications.

    What are common mistakes to avoid when designing entity relationship diagrams?

    The most frequent mistakes fall into a few clear categories. Missing cardinality notation leaves the diagram ambiguous about whether relationships are mandatory or optional – which translates into missing NOT NULL or foreign key constraints in the implementation. Overloading entities with attributes that belong to related entities creates wide, unnormalized tables. Using unclear or inconsistent naming conventions makes the diagram harder to read and the schema harder to query. And perhaps the most operationally costly mistake: treating the ERD as a one-time deliverable rather than a living document that must stay synchronized with the production schema as it evolves.

  • SME Data Governance: 6 Pillars and 8 Steps in 2026

    SME Data Governance: 6 Pillars and 8 Steps in 2026

    data governance

    How to Implement Data Governance in an SME Without Overburdening the Team

    Data governance is not an IT project reserved for enterprise corporations. For a tech SME, it relies on six simple pillars: clear responsibilities, mapping, quality, proportionate security, GDPR compliance, and active steering. With living schema documentation, an SME can deploy operational governance in eight concrete steps at a controlled cost (a shared DPO costs €1,500–€4,000/year) and with a single source of truth accessible to all roles: developers, analysts, product managers, and support teams.

    The reality on the ground is concerning: according to CNIL, only 41% of small and mid-sized businesses maintain a processing activities record, even though it is legally required for all companies. According to Integrate.io (2026), 85% of organizations claim to have a governance framework, but only 3% of their data is truly “fit for purpose.” Declared governance and actual governance are two entirely different things.

    This article details the concrete steps to implement governance tailored for a tech SME operating with limited resources and scaling progressively.

    Table of Contents

    Why Data Governance is Becoming Unmissable for SMEs in 2026

    Without a shared framework, every team manages data according to its own logic, and the business unknowingly accumulates information debt. CRM, ERP, SQL databases, shared spreadsheets: each system becomes a competing version of the truth, and no one knows which one is authoritative.

    The Risks of Ungoverned Data: Scattered Records and GDPR Non-Compliance

    An SME operating without governance exposes its personal data to concrete risks: poorly secured customer files, data processing lacking documented legal bases, and third-party vendors not compliant with GDPR. A processing activities record is mandatory for all companies regardless of size and not just enterprises with over 250 employees. Beyond regulatory compliance, the operational cost is direct: time wasted searching for which table holds which piece of data, decisions made using outdated exports, and slowed onboarding due to a lack of shared documentation.

    Concrete Benefits: Reliable Decision-Making, Secure Usage, and Reduced Information Chaos

    An operational governance framework even a lightweight one which ensures you know who uses what data, in which system, and with what level of validity. Decision-making becomes dependable, accesses are tracked, and new hire onboarding happens smoothly without pulling away senior engineers. 86% of companies are increasing their data management investment in 2026 (Integrate.io) with a clear sign that this movement responds to real pressure regarding decision quality.

    The Acceleration of AI: An Urgent Need for Understandable and Traceable Data

    The adoption of generative artificial intelligence amplifies this challenge. According to Informatica (2026), 69% of companies have integrated GenAI into their business operations, up from 48% the previous year. A model trained on poorly qualified or un-traced data produces unreliable and potentially non-compliant outputs. Governance becomes the core foundation upon which any serious AI strategy rests.

    The 6 Pillars of Governance Tailored for SMEs

    SME data governance is not a scaled-down version of enterprise frameworks. It rests on six interconnected pillars, each fully actionable without a full-time CIO or multi-month consulting projects.

    Pillar 1: Clear Responsibilities – Who Decides, Who Controls

    Appointing a designated Data Owner is enough to get started. This role can be filled by the CTO, a lead developer, or a tech-savvy office manager. It does not require 100% of their bandwidth, but it demands a documented mandate and explicit authority within the organization. Without an identified owner, no rules hold up over time.

    Pillar 2: Simple Mapping – Inventorying and Locating Data

    Before optimizing anything, you must know what exists. A baseline mapping lists systems, data types, owners, and sensitivity levels. For a 20 to 50-person SME, this inventory can be completed in one or two days, not a full quarter-long project.

    Pillar 3: Quality and Lifecycle – Single Source of Truth Per Data Field

    64% of organizations cite data quality as their main challenge, with 77% rating theirs as average or poor (9cv9, 2026). The remedy begins with a simple rule: one data point, one single source of truth. Prevent duplicate entries between your CRM and ERP, define which table is authoritative for revenue or inventory figures, and set up clear update policies per data owner.

    Pillar 4: Proportionate Security – MFA, Backups, and Tracked Access

    Security in an SME does not require a full-time CISO. It starts with multi-factor authentication across all critical platforms, quarterly-tested backups (not just scheduled ones), and periodic access reviews. Every access grant to sensitive data must be justified by an actual business need and properly documented.

    GDPR requires documenting every instance of personal data processing: purpose, legal basis, retention period, and recipients. For a tech SME, this applies to the CRM, authentication logs, billing records, and candidate data if active hiring is underway. A structured 8-column spreadsheet is all you need to launch.

    Pillar 6: Active Steering – Audits, Action Plans, and Reviews

    Governance without active steering quickly becomes obsolete. Semi-annual reviews allow teams to verify that records remain up to date and that active access rights mirror current workforce setups. To make data understandable and accessible across all team profiles for developers, analysts, product managers, and support teams, living database schema documentation acts as the connective tissue holding these six pillars together.

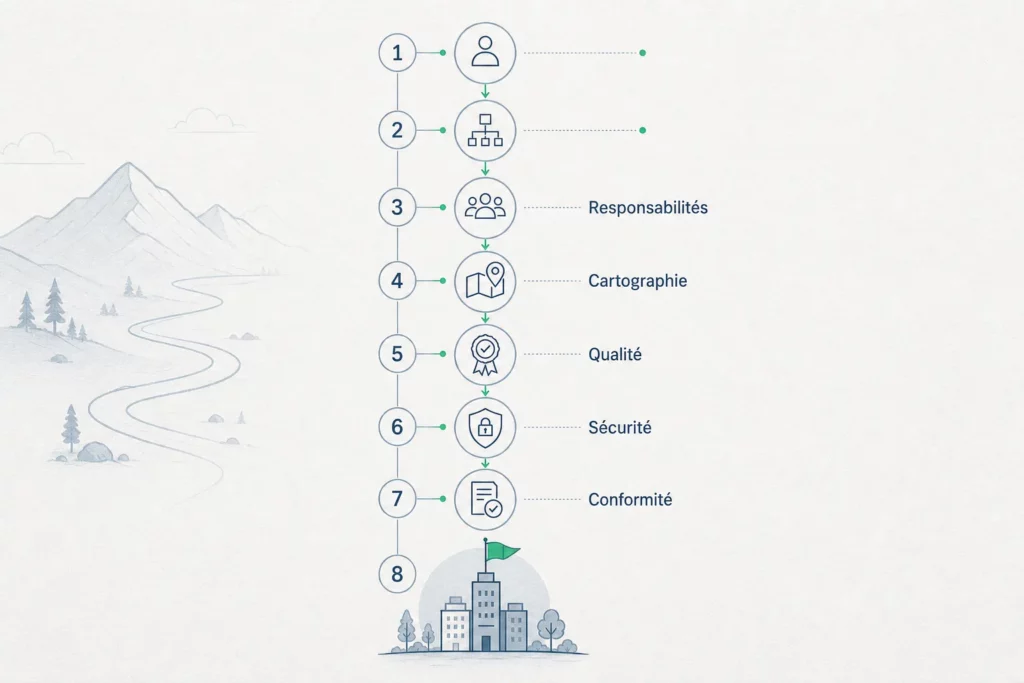
    How to Concretely Implement This Governance in 8 Steps

    This is the practical angle generic guides skip: a roadmap tailored specifically for a 10 to 100-person tech SME facing limited resources and scaling requirements. These eight steps follow a logical sequence with concrete deliverables at every milestone.

    Step 1: Initial Audit – Inventorying CRM, ERP, Excel, and Scattered Data

    Spend two days inventorying all systems storing data: SQL databases, SaaS platforms (CRM, support, payments), shared files, and recurring data exports. Identify what contains personal data and what is mission-critical. This step is the only one requiring cross-team input, it rarely takes more than a single sprint.

    Step 2: Appoint a Data Owner – Lightweight RACI Framework (Part-Time Friendly)

    Formalize your data RACI matrix on a single page: who is Accountable for each system, who is Consulted when making structural decisions, and who is Informed about incidents. This document removes ambiguity without creating bureaucracy. In an SME, the Data Owner acts as a facilitator, not a top-down authority.

    Step 3: Build the GDPR Record – Simplified Template with Quarterly Updates

    An 8-column template is sufficient: processing activity, owner, purpose, legal basis, data involved, recipients, retention period, and security measures. CNIL provides downloadable templates built specifically for SMEs. Schedule a 30-minute quarterly review, plenty of time to stay compliant provided the initial audit was done right.

    Step 4: Establish Access Controls – Role-Based and Need-to-Know Access

    Define access levels based on roles (developer, analyst, support, executive) and ensure every active account belongs to a current team member. Revoke access immediately for departed staff. Enable MFA across all critical software. This step takes a single day initially, followed by 30 minutes per quarter for routine maintenance.

    Step 5: Define Retention and Archiving – Clear Rules by Data Type

    Instead of an overwhelming matrix, start with three simple categories: active data (kept for the duration of the relationship), archived data (kept per statutory requirements), and data scheduled for deletion (anything exceeding legal limits). Document these policies directly inside your GDPR processing record.

    Step 6: Secure in Phased Waves – Start with MFA and Backups

    Deploy security in three distinct phases: MFA and verified backups in Week 1, access reviews and encryption at rest in Month 1, followed by password policies and incident response planning in Quarter 1. Trying to roll out everything at once guarantees incomplete execution.

    Step 7: Document the Database Schema – The Pivot for Understanding and Reuse

    This is the exact step generic governance resources miss, yet it is essential for a tech SME. Automatically documenting database schemas, tables, columns, relationships, types, constraints, turns an opaque SQL database into an asset everyone can understand. A tool that imports schemas directly from MySQL, PostgreSQL, or SQL Server without heavy setup cuts timeline execution by weeks. Schema documentation acts as the glue making the six pillars work: without it, teams interpret fields differently, leaving governance purely theoretical.

    Step 8: Steering and Iteration – Semi-Annual Reviews and Agile Adjustments

    Schedule two half-day reviews per year. Standard agenda: audit GDPR processing records, review active user permissions, check backup health, evaluate recent incidents, and update schema documentation. Data governance is not a finished project: it is an inherently agile maintenance process.

    Comparison Table: A Lightweight Model to Get Started

    Core Components by Size and Complexity

    ComponentSME (10-30 employees)SME (30-100 employees)
    Data OwnerCTO or Lead Dev (part-time)Dedicated role (20-30% allocation)
    GDPR RecordShared spreadsheetDedicated tool or structured spreadsheet
    Schema DocumentationAutomated database importAutomated import with business annotations
    ReviewsTwice a year4 times a year
    DPOShared or outsourced DPOShared DPO recommended

    Human Resources and Estimated Budgets

    SME governance does not require massive capital expenditure. A shared DPO costs between €1,500 and €4,000/year depending on processing complexity, a fraction of the cost of a GDPR fine or an unmanaged data breach. Database schema documentation is accessible via freemium plans without upfront commitment. The primary investment is human bandwidth: expect two to four man-days for kickoff, followed by two man-days per year for ongoing maintenance.

    GDPR Compliance for SMEs: What Do You Really Need to Do?

    Data governance SME

    SME GDPR compliance is surrounded by myths that discourage business leaders before they even begin. Here is the reality of your actual legal obligations without the drama.

    Appointing a Data Protection Officer (DPO) is legally required in only three scenarios: large-scale processing of sensitive data, systematic large-scale monitoring of individuals, or if you are a public authority. A standard tech SME generally falls outside these criteria. However, maintaining a processing activities record is mandatory for every single company without exception, yet only 41% of small businesses comply (CNIL, 2026).

    How to Leverage a Shared or Fractional DPO

    A shared DPO serves multiple companies simultaneously, significantly lowering individual costs. They oversee processing records, handle data subject access requests, manage incident reporting, and align vendor contracts with GDPR standards. For an SME handling customer, employee, or prospect data, this represents the most pragmatic path: acquiring legal expertise without taking on headcount.

    Common Pitfalls Exposing SMEs to Risk

    Three compliance mistakes repeatedly surface during audits: working with SaaS tools or agencies without signed Data Processing Agreements (DPAs), building a processing record once and abandoning it (the “ghost registry”), and failing to document international data transfers outside the EU. These three issues are the first items regulators inspect. Once identified, they can be fixed in less than a day of work.

    What Tools and Resources to Structure Governance Without Complexity?

    Structuring data governance does not require massive investment. Public frameworks are robust, and automating database schema documentation offers the quickest operational win for a tech SME.

    Templates for Mapping and GDPR Registers

    CNIL publishes a downloadable processing activities record template tailored for small businesses. This template includes all mandatory regulatory fields, offering a solid starting point. For data mapping, a shared spreadsheet listing one system per row is sufficient up to 50 employees, the goal is maintaining an active inventory, not buying complex software.

    Official Frameworks (CNIL, ISO 38505-1 Guide)

    CNIL maintains a dedicated SMB portal offering practical guidelines on processing records, individual rights management, and vendor oversight. The ISO 38505-1 standard provides an international reference framework for data governance, useful for aligning your approach with recognized industry benchmarks without requiring formal certification.

    Automation: The Critical Role of Schema Documentation

    For a tech SME, automated database schema documentation provides the most immediate ROI. Instead of manually maintaining a data dictionary in a disconnected Word document, automated schema imports directly from MySQL, PostgreSQL, or SQL Server guarantee a single source of truth that stays synchronized with production. Data teams and architects steering governance rely on this documentation to onboard developers faster, streamline audits, and resolve GDPR inquiries without digging through source code. Step 7 is what makes the six pillars sustainable.

    FAQ – SME Data Governance Questions Answered

    What exactly is data governance?

    Data governance is the collection of rules, responsibilities, and processes defining how an organization manages, protects, and uses its data. For an SME, it isn’t a bloated project with a dedicated budget, but a baseline framework ensuring data remains reliable, accessible to authorized roles, and compliant with legal requirements with GDPR included.

    Is an SME legally required to appoint a DPO?

    No, except in specific scenarios: large-scale processing of sensitive data (health, biometrics), systematic large-scale monitoring of individuals, or public bodies. The vast majority of tech SMEs do not fall into these categories. However, maintaining a record of processing activities is mandatory for all businesses, including small startups. These two requirements are frequently confused.

    How do I start governance without dedicated IT staff?

    Begin with a system audit (two days max) and your GDPR processing record (a spreadsheet, half a day). These two quick wins address immediate regulatory exposures. Database schema documentation can follow using an automated import tool connected to your SQL database no DBA expertise required. You don’t need a full-time CIO to launch.

    What is the actual cost of setting up governance in an SME?

    A shared DPO costs between €1,500 and €4,000/year depending on processing complexity. Schema documentation tools are available via freemium plans without requiring a credit card. The real investment is internal bandwidth: two to four man-days for initial setup, and two man-days per year for maintenance a negligible cost compared to a GDPR fine or a customer data breach.

    How do I update an existing GDPR processing record for compliance?

    Export your current record and review it column by column: does every processing activity have a documented purpose, legal basis, retention period, and security setup? Complete missing entries or delete outdated activities. Schedule a 30-minute review every quarter. An imperfect, regularly maintained record is far better than a perfect one left untouched.

    How long does it take to build effective data governance in an SME?

    A functional foundation takes 4 to 8 weeks with part-time dedication: initial audit in Week 1, GDPR record in Week 2, access rules and MFA in Weeks 3 and 4, followed by schema documentation and vendor contract reviews in Weeks 5 through 8. Governance is never “finished” it adapts continuously as your team and product grow.